2 min read
Dec 22, 2023
Table of contents
01 Configure Timescale as a data sourceGet started with Grafana and Tiger Data
Learn how to set up the integration, create a dashboard, and visualize data.
See the docsGrafana ships with built-in Prometheus, PostgreSQL, Jaeger, and other data source plugins that allow you to query and visualize data from a compatible database. To add a data source in Grafana you must be signed as a user with organization administration role privileges.
To connect Grafana with Timescale, start by installing Grafana. For more information about installing Grafana, see the Grafana documentation.
This section shows you how to connect Timescale as a data source in Grafana.
To configure Timescale as a data source, you need to create a service and then configure Timescale as the data source in Grafana.
Create service.Download the config. This .sql file contains the credentials that you require to configure TimescaleDB as a data source on Grafana.To configure the TimescaleDB service on Timescale with your Grafana installation, log in to Grafana and proceed to step 5 in this procedure.
User and Password field for your service.Configuration → Data sources. The data sources page lists supported data sources for the Grafana instance.Add data source.PostgreSQL in the search field and click Select.Name field, type the name that you would like for your dataset on TimescaleDB.PostgreSQL Connection section, type the Database, User, and Password fields using the .sql file that you downloaded when creating the TimescaleDB service.Host type <HOST>:<PORT> from the .sql file that you downloaded.TLS/SSL Mode as require.PostgreSQL details enable TimescaleDBSave & test button. A connected message will now appear.To double-check if the connection is successful, click through to Connections and confirm that your new data source is listed under Data sources.
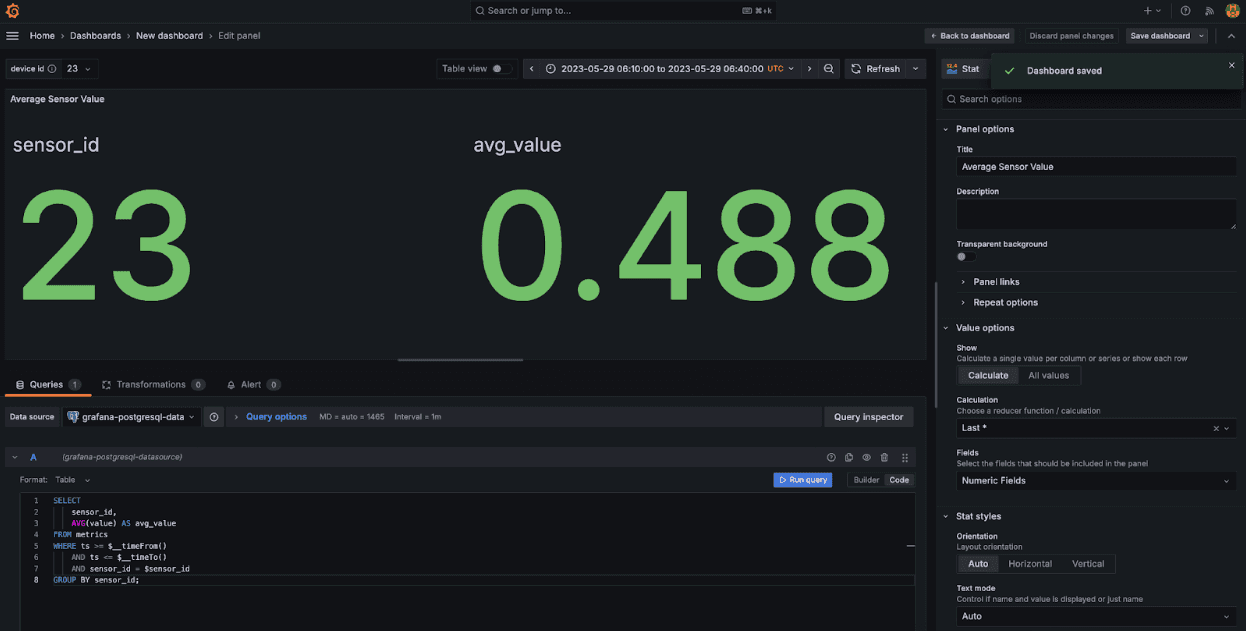
When configuring TimescaleDB as a data source in Grafana, you can create panels populated with data using SQL. Learn more about ways to visualize this data with the NYC Taxi Cab tutorial.

How to Build an IoT Pipeline for Real-Time Analytics in PostgreSQL
PostgreSQL is a great option for IoT data and the real-time analytics it often requires. Need proof? Read how we built and benchmarked an IoT pipeline.
Read more
Receive the latest technical articles and release notes in your inbox.