

webinar
Five Warning Signs Your Energy Telemetry Database Has Outgrown Its Architecture
Date
Wednesday, December 09, 2026
Time
12:00 - 1:00 ET
Location
Virtual (link sent upon registration)
Abstract
Every database has bad days. A slow query after a schema change. Replication lag during a spike. An autovacuum job that runs long enough to make you nervous. Those are tuning problems, they have tuning solutions, and a senior engineer fixes them in an afternoon.
There is a second category. The kind where every fix creates the need for the next fix, where performance degrades not because of one bad query but because the workload has grown into territory the database was never designed for. Teams burn two quarters optimizing their way around this before realizing the optimization was the trap.
This session is a diagnostic. Five signs, each with a specific measurement you can take. Count how many apply to your system and you get a straight answer about whether you have a tuning problem or an architectural one.
We frame it for energy telemetry throughout, because the numbers are different when you are absorbing 10,000 points a second from a charging network or a storage fleet, holding it for a multi-year compliance window, and serving a portfolio dashboard off the same tables.
What you'll learn
The difference between optimization that is cumulative and optimization that is cyclical, and how to check which one you are doing by looking at your sprint backlog
How to test whether your slowest queries are scan-bound, and what it means if execution time tracks the time range linearly
The point at which adding an index to help a fleet dashboard measurably breaks your ingest SLA, and why that conversation is itself the signal
What to do at each score band, and why a score of four or five does not mean leaving Postgres
Can’t make it live? Register anyway and we’ll send you the recording.
Register free
You might also be interested in
workshop
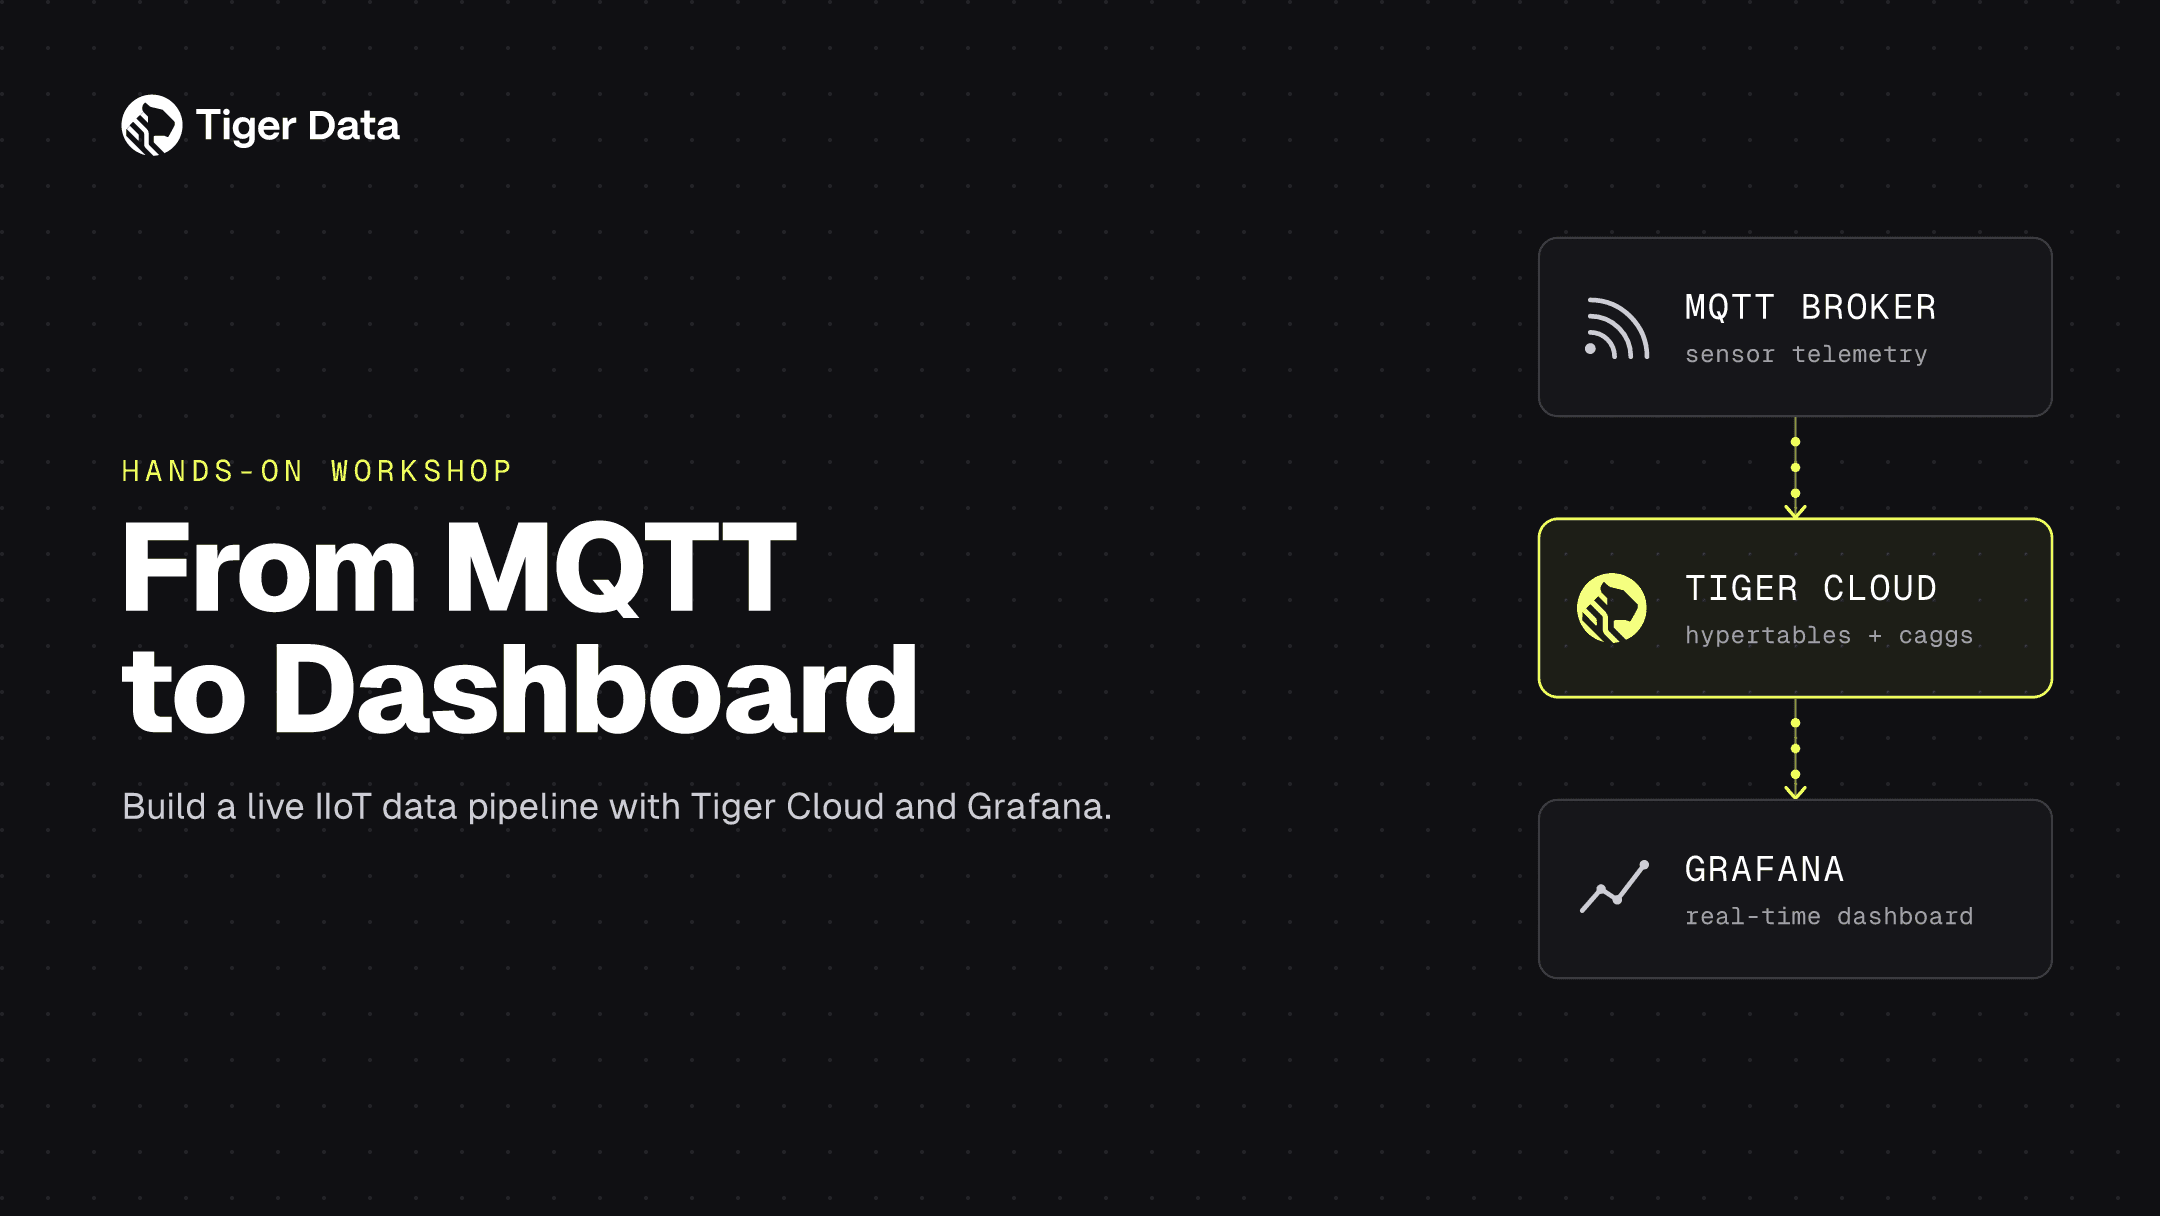
From MQTT to Dashboard Real-Time IIoT Pipelines with Tiger Cloud
In this hands-on workshop, you'll build a working pipeline from MQTT to Tiger Cloud to Grafana. You'll subscribe to an MQTT broker, ingest live sensor readings into Tiger Cloud, and wire it all to a real-time Grafana dashboard.
Sep 09, 2026
Virtual (link sent upon registration)
NYC
Livestream
Aggregate 2027
Tiger Data's free one-day event in NYC for the people building on time-series and Postgres — March 10, 2027.
Mar 10, 2027
New York
webinar
Five Warning Signs Your Telemetry Database Has Outgrown Its Architecture
Five specific, measurable warning signs that tell you whether your telemetry database needs more tuning or a fundamentally new architecture.
Oct 14, 2026
Virtual (link sent upon registration)