

On Demand
webinar
Sizing a Telemetry Database Before the Pilot Scales
Abstract
Every oilfield telemetry project starts the same way. A handful of wells, a few hundred tags, a database that answers in milliseconds. Then the deployment expands to the whole field and the architecture that worked for the pilot stops working entirely. McKinsey found that as many as 74% of manufacturers never got past this stage, and the pattern in upstream oil and gas looks the same.
The reason is usually not a bad query. It is that nobody drew the boundary. Every database has a range of conditions inside which it performs to spec, and outside which it fails. That boundary is the performance envelope, and it is defined by three things: how much storage you can afford, how fast you can ingest, and how slow your queries are allowed to get.
This session walks through how to calculate that envelope for a real well-monitoring workload before you commit to an architecture. We will do the math on a 10,000 tag deployment at 1 Hz, look at what a year of retention actually costs on cloud SSD, and show where the ingest wall sits. Then we will look at what happens to that envelope when you add TimescaleDB to Postgres rather than replacing it.
What you'll learn
How to calculate total data volume and five-year storage cost for a given tag count, sample rate, and retention requirement
Why the maximum ingest rate degrades as a Postgres table grows, and how to spot the backlog before it becomes unrecoverable
Why wide queries (correlating tags at one moment) and deep queries (one tag over months) pull optimization in opposite directions
The safety factor to design against, and why running at 80% of measured maximum is the practical ceiling
Get Instant Access
You might also be interested in
workshop
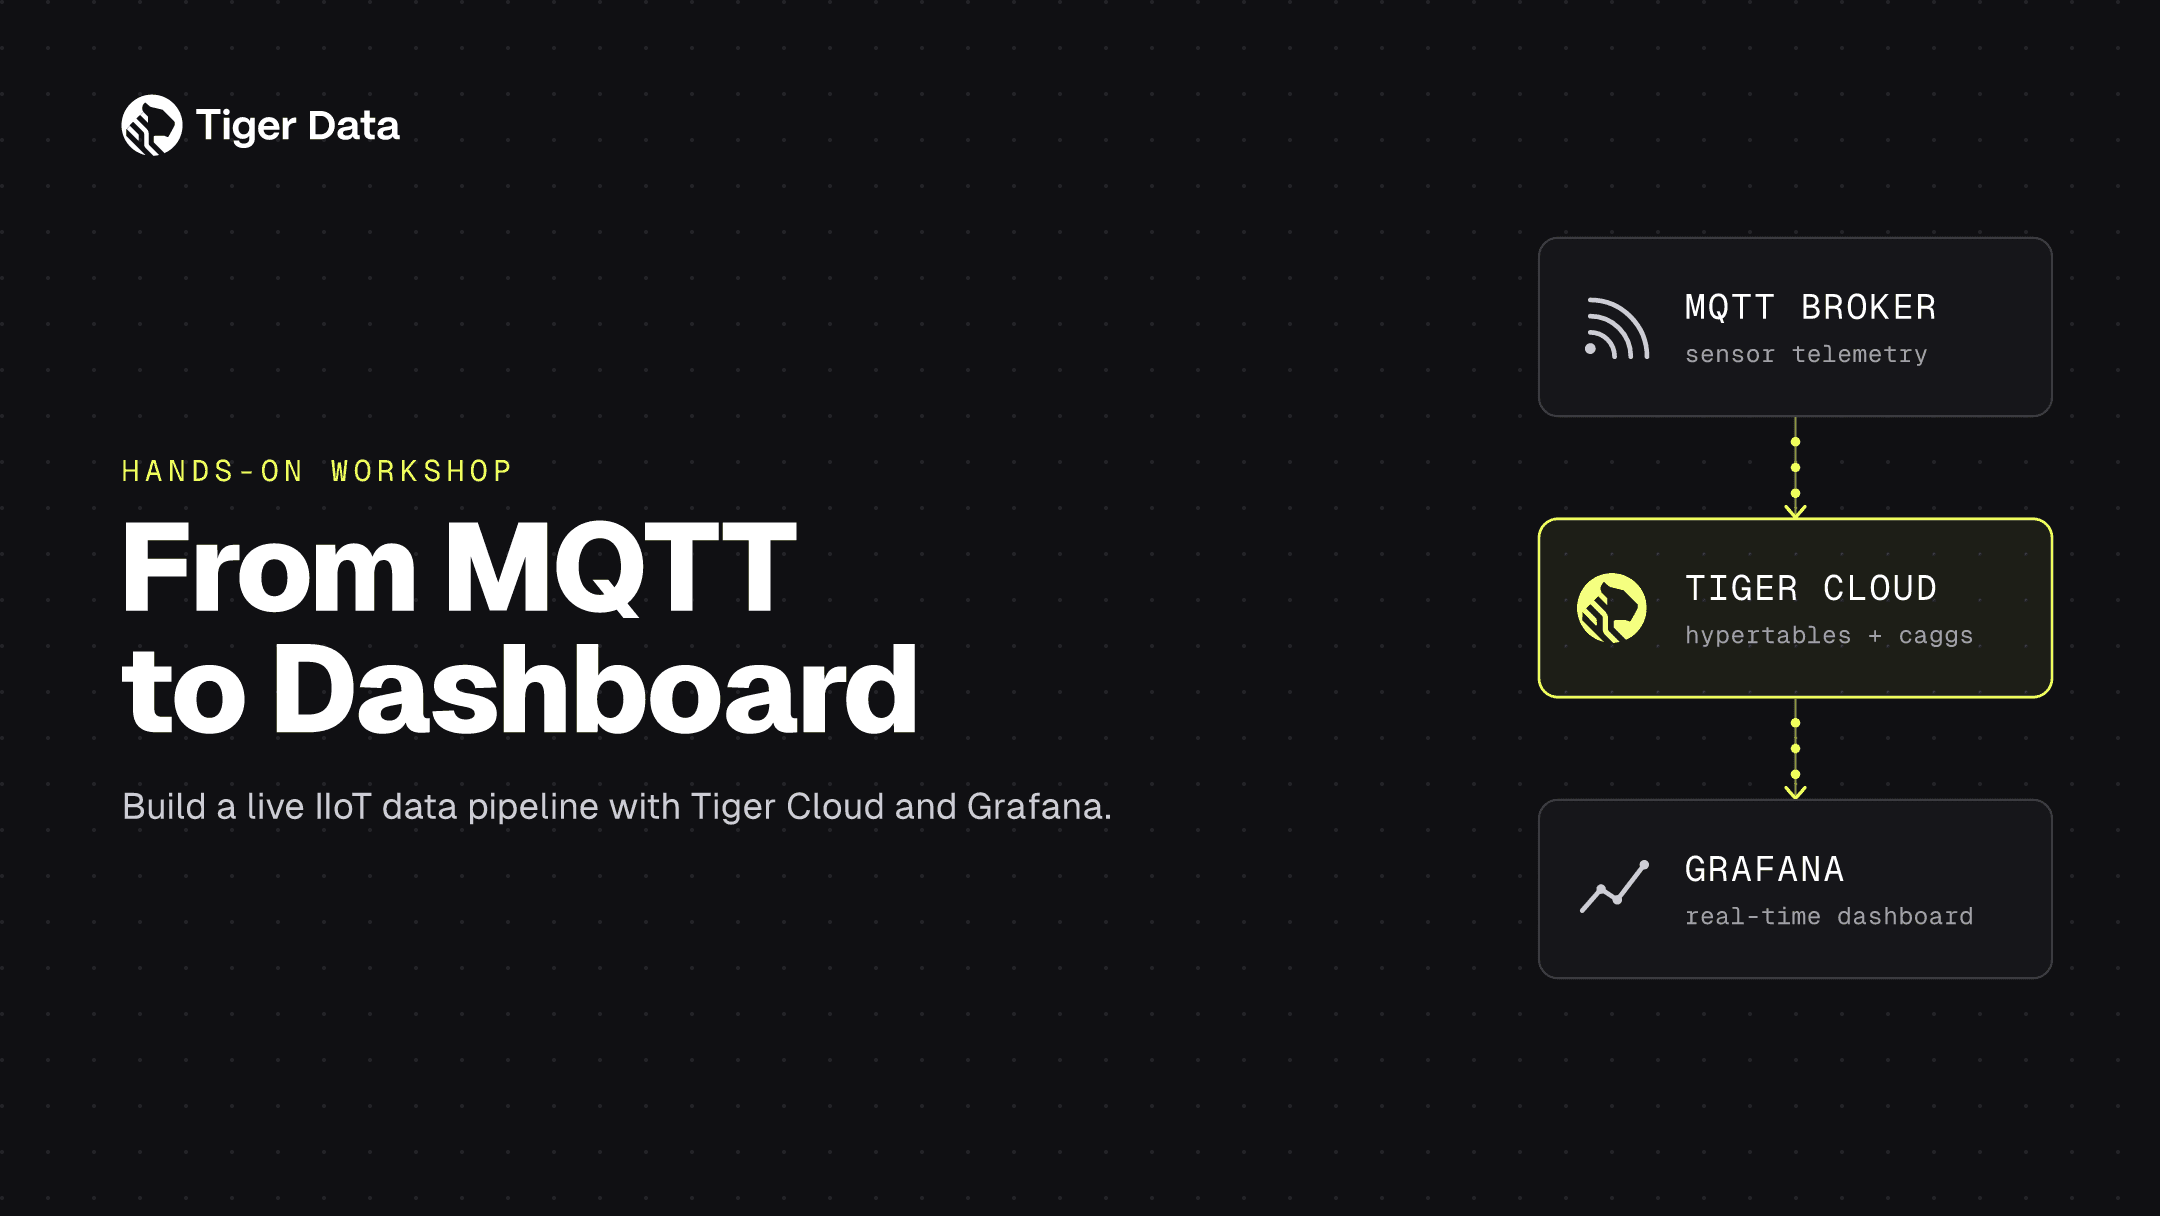
From MQTT to Dashboard Real-Time IIoT Pipelines with Tiger Cloud
In this hands-on workshop, you'll build a working pipeline from MQTT to Tiger Cloud to Grafana. You'll subscribe to an MQTT broker, ingest live sensor readings into Tiger Cloud, and wire it all to a real-time Grafana dashboard.
Sep 09, 2026
Virtual (link sent upon registration)
webinar
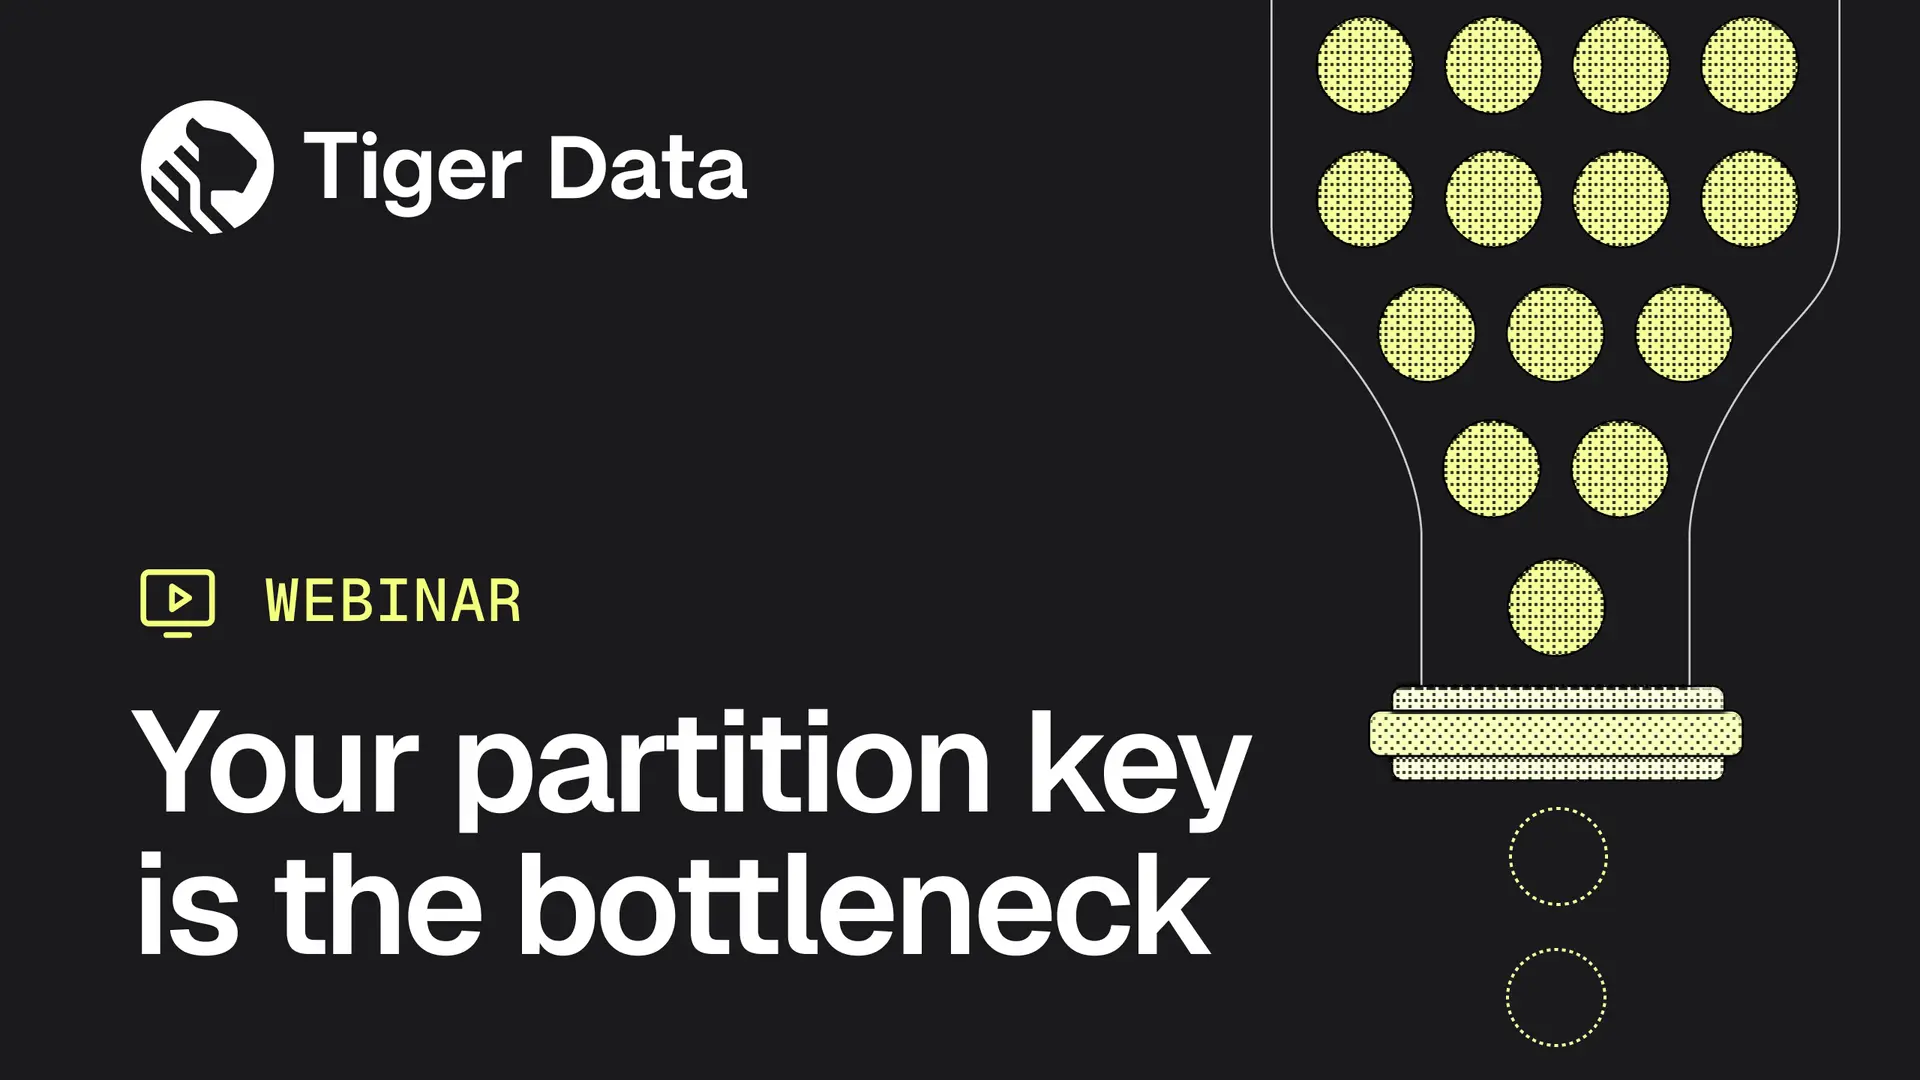
Your Partition Key Is the Bottleneck: Fixing Write Hot Spots in EV Charging and Asset Fleets
A skewed partition key can throttle your entire write path while other partitions sit idle. Learn to spot and fix hot spots in EV and asset fleets.
Nov 05, 2026
Virtual (link sent upon registration)
NYC
Livestream
Aggregate 2027
Tiger Data's free one-day event in NYC for the people building on time-series and Postgres — March 10, 2027.
Mar 10, 2027
New York